Turn back time: oncology trials are getting shorter
This article was originally published in Scrip
It is widely accepted in the biopharmaceutical industry that clinical trial protocols are growing in complexity; many in the business bewail that the duration of trials is increasing, with patient enrollment a frequently-cited problem in clinical development.
These three purported truisms are the most frequently cited reasons for the rising costs of clinical trial development. For the most part, these are based on anecdotal reports from sponsors.
In 2008, Kenneth Getz published an analysis in Scrip Regulatory Affairs that examined protocol design trends and clinical trial performance and reported that clinical trial durations (first patient/first visit to last patient/last visit) increased significantly between 2003 and 2006, compared with the earlier four year analysis period (1999 – 2002). But this analysis was based on a small sample size: 57 unique protocols (trials).
More recently, a report from ecliniqua.com stated that “Phase II cycle times for oncology patient enrollment have steadily increased while Phase III enrollment times increased from 2006 to 2009 before dropping in 2010.” The analysis was based on 700 trials, using site-level data.
In this analysis, we look at two high prevalence diseases in oncology (in entirety by Phase (II or III), as well as by patient stratification) and report on trends in industry-sponsored trial durations over the past 15 years. We also look across cancer types for trials involving targeted therapies.
Citeline has been capturing clinical trial benchmark data for more than four years; these data consists of trial-level dates or durations. As of October 2012, across the database there are more than 66,000 trials with known study durations and over 32,000 trials with known enrollment durations.
Within the oncology coverage of Trialtrove (Citeline’s clinical trials database), trials with known enrollment durations number over 7,300 and those with known study durations number over 5,600. For this analysis, we focused on Phase II and Phase III trials in breast cancer, non-small cell lung cancer and also cancer diseases where targeted therapies were being studied. The time frame covered approximately the years 1995 to 2010, and the total data set consisted of 471 Phase III trials and 1101 Phase II trials.
Breast cancer trial analysis – across all patient populations/segments
For Phase II completed trials, 370 trials (trials in the supportive care disease area cross-reference for breast cancer were removed from this data set, as well as all other data sets used in the overall analysis reported in this analysis) were found in Citeline’s Trialpredict timing data with known actual data for any of enrollment, study period or total trial durations. In looking at five year cohorts of data, the averages for critical, trial-level timing benchmarks are shown in Table 1.
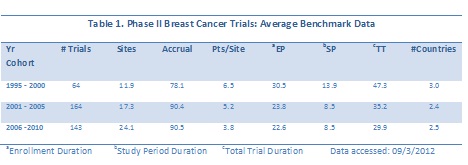
Of note are the trends in decreasing average durations for enrollment period, study period and total trial period, while the numbers of sites increased during each five year period, but the geographic breadth decreased slightly (see average count of countries). When the data are plotted as a function of start date, the downward trend in overall trial duration is also observed. The linear trend line for total trial duration has a clear downward slope (Figure 1), while the trend line for numbers of sites has a slight upward slope.
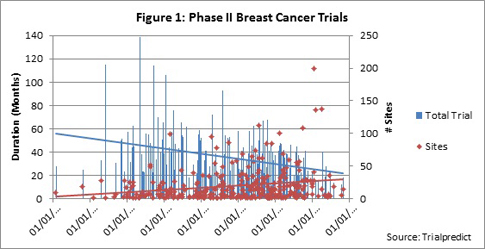
When accrual is plotted as the second vertical axis, the trend line is also slightly positive, indicating a very slight upward or positive trend; thus increasing patient demand is growing over time (Figure 2).
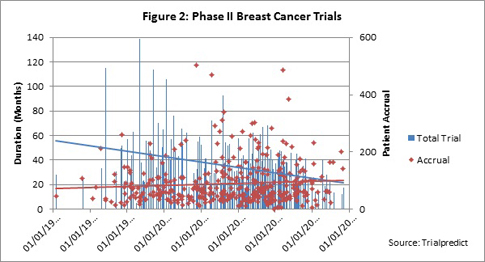
Which is the major factor in the decrease in total trial duration: enrollment period or study period? With the slight upward trend in patient demand, are trials taking longer to enroll? For the vast majority of trials included in the analysis, the outcome/endpoints are event driven. As trials increase in complexity, are the study periods increasing?
As seen in Figure 3, both the enrollment and study periods indicate a downward trend over time; this was seen for both a linear as well as exponential trend analysis (linear shown).
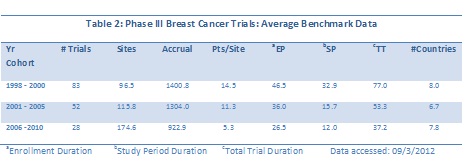
For the 162 Phase III breast cancer trials analyzed, the multi-year cohort averages again reveal decreases in enrollment, study period and total trial durations, and indicate a growth in numbers of sites in breast cancer trials over time. Accompanying the increase in sites is a downward trend in enrollment rates over time (patients/site).
The numbers of trials in the more recent two cohorts is significantly smaller that the earliest three year period, so a view of the entire data set by start date is really needed to discern any possible trends (Figure 4).
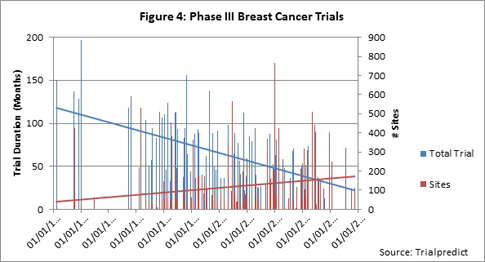
The trend toward decreasing trial duration is quite strong in this data set, while the increase in numbers of sites is slightly positive. (Note that either a linear or an exponential trend line demonstrates the same directionality.) For accrual over time, the data trend line is relatively flat (data not shown).
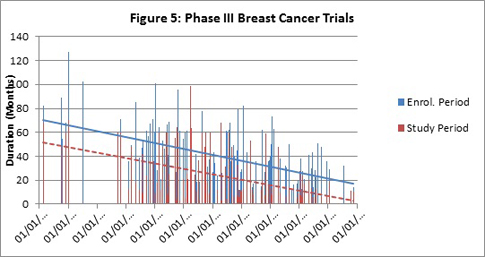
As was observed for the Phase II data set, both enrollment and study period durations show a strong trend toward decreasing for the Phase III data set (Figure 5). The majority of the data is clustered in the years 1994 to 2007. Analysis of just these data (ignoring pre-1994) reveals a continued downward trend, but the slope is less marked. As full publication of trial results becomes available in the public domain, Citeline will continue to add the critical benchmark data to re-examine trends for more recent years.
Breast cancer trial analysis by patient segmentation
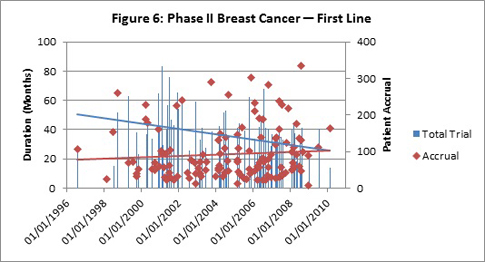
To delve further into possible reasons behind the trend toward decreasing trial durations (and enrolment period (EP) and study period (SP)), analysis of trials involving first-line versus second-line or greater/relapsed/refractory patients was performed. For the 130 Phase II trials involving (but not limited to) first-line patients, downward trends were observed for total trials duration, enrollment periods and study periods (see Figure 6 for Total trial/accrual analysis; other data not shown.)
The average benchmark metrics for Phase II first line versus second-line trials are summarized in Tables 3 and 4. If one looked solely at the average benchmark data for cohorts of years, the trends would be masked, as evident in the Table 4 below. For example, the numbers of sites and patients in Phase II first-line trials look to increase and then fall back, but trend lines over the continuous data reveal a small positive trend in both metrics.
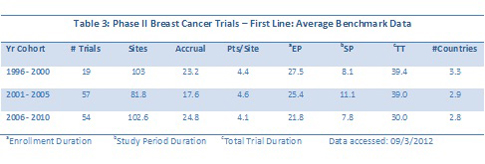
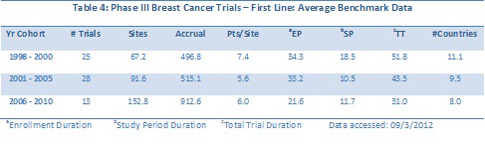
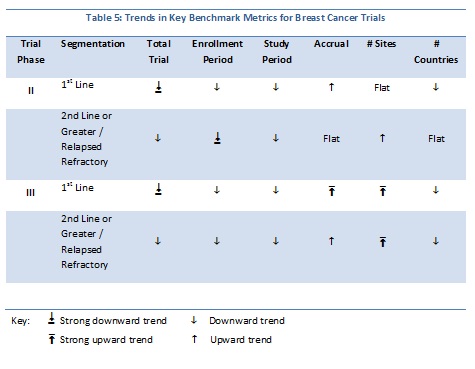
Trends for key metrics for breast cancer trials segmented by patient populations reveal more downward trends overall. Table 4 summarizes the full, continuous trends for Phase II and III trials segmented by either first-line or second-line and greater/relapsed refractory. One other factor investigated was geographic breadth: were sites in more countries being used over time? The continuous data indicate that this is not the case, at least for breast cancer trials.
Are any companies consistently beating the averages?
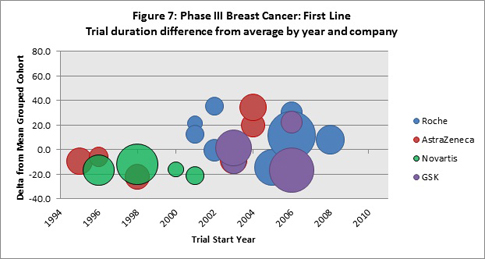
Figure 7 shows an analysis for first-line, Phase III breast cancer trials, for which Citeline has captured trial duration data. The plot shows only the companies that were the sole trial sponsor of four or more trials (within the data subsets), and for each of these trials the difference from the average trial years cohort (refer to Tables 2 and 3) and the specific trial metric was determined. The vertical axis shows these differences, both for trials that had durations longer than the average and for those shorter than the average. The size of the bubble is determined by the patient accrual value for the specific trial. The “zero” horizontal line represents the cohort average and is the point of reference.
With the exception of Novartis’ four trials that started between 1996 to 2002, trials sponsored by Roche (13), AstraZeneca (6) and GSK (4) performed better, as well as, or worse than the cohort averages. For Novartis, the relatively older trials all beat the average trial durations. Roche’s more recently started trials (post 2008) beat the average, but these trials have a relatively lower patient demand.
Looking at Phase II first-line trials (Figure 8) where the total trial duration has been identified, it appears that the companies with the largest numbers of trials in the data set equal the average for the cohort years, or are slightly faster during the more recent years (2002 and later).
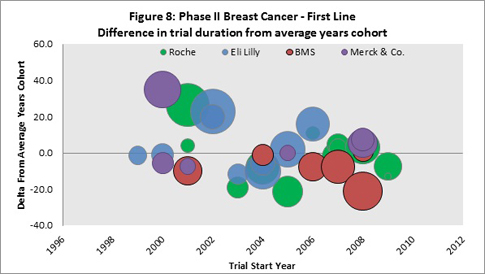
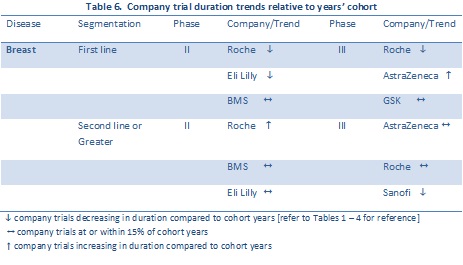
Overall performance (with respect to average trial durations) for company sponsors are summarized in Table 6. The data is limited to sponsors with the largest numbers of trials for which Citeline has full trial duration data. Trends are indicated for the time period 2000 – 2010.
Trends in other oncology trials: non-small cell lung cancer
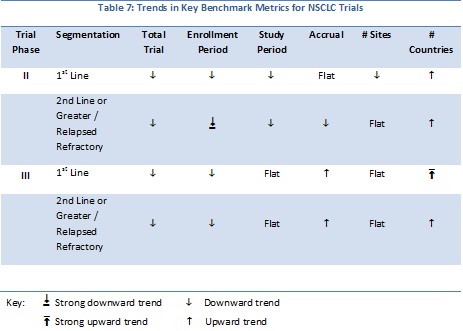
Citeline trial data for Phase II and III non-small cell lung cancer (NSCLC) have been analyzed for trends in trial duration, enrollment period, study period, numbers of sites, patient accrual and geographic breadth (numbers of countries). The data are summarized in Tables 7 and 8. The number of Phase II industry-sponsored trials with either enrollment, study period, or total trial duration date was 358; For Phase III trials there were 128 trials available for analysis.
For NSCLC, the vast majority of the metrics show a downward trend, similar to that observed for the breast cancer analyses. One major difference is that, for both phases and patient segmentation, there is an upward trend in the numbers of countries over time indicating that the geographic breadth of trials is on the upswing.
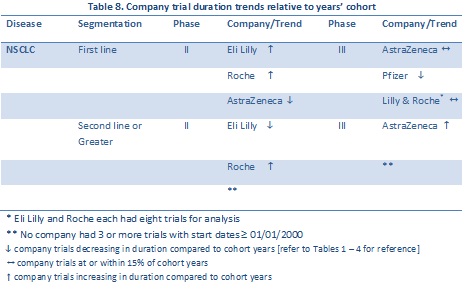
The companies with the largest numbers of trials available for comparison to the approximate five year average trial cohorts are listed in Table 8. Of note, both Eli Lilly and Roche “beat” the average for Phase II.
Oncology trials involving targeted therapies
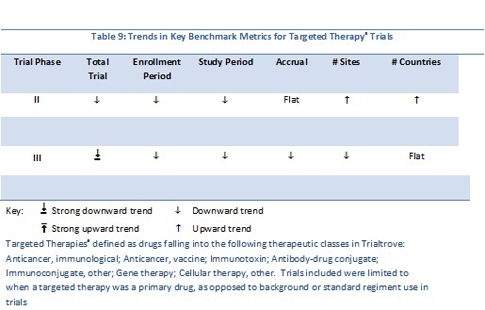
For the 572 Phase II trials, the diseases covered were many and varied. Using Trialtrove’s disease classifications in oncology, trials spanned 60 diseases. The top five diseases included non-Hodgkin’s lymphoma (NHL), breast, colorectal, NSCLC and melanoma. For the entire Phase II data set, the total trial duration declined between 1995 and 2010; the linear trend line for patient accrual is flat while sites and numbers of countries involved in trials increased (Table 9).
For the 143 Phase III trials analyzed, patients with 21 different oncology diseases were recruited. The top diseases in this data set included NHL, colorectal, breast, head and neck and NSCLC. Overall trial duration declined, as did patient demand. In contrast to Phase II trends, a decreasing trend in numbers of sites is evident, while geographic breadth remained flat.
Using a larger data set than in previous analyses, unexpected trends in trial timing benchmarks have been revealed. While this analysis focused on only two cancer diseases, and a cross-section of trials involving targeted therapies, the data show that there is an overall trend toward decreases in trial durations, enrollment period, study period, and the sum of the two periods (trial duration). These results have been verified in another Citeline analysis on multiple diseases in several therapeutic areas that will be presented at the Partnerships in Clinical Trials Congress (Nov 6 – 9, 2012).
What has not been included in this presentation is the time required to analyze trial data. This is a difficult metric to capture in the public domain. Certainly, as was reported in the Getz analysis, there is a very real trend toward increasing secondary endpoints/measurements in oncology protocols. A Citeline analysis from 2008 demonstrated an increase in the numbers of trials started that included quality of life outcome measures beyond standard disease outcome measures; the analysis found this to be the case in particular for pivotal, global trials.
It seems logical to assume that the analyses durations are increasing as more and more measures/endpoints are being added to protocols. The longer analysis times feed delays in publication of full trial results. Clinical trial transparency has improved over the last decade, and the FDA’s call for trial results transparency will ultimately help in deriving even better trial timing benchmarks in the future.
Prior to completing the present analysis, Citeline anticipated that there would be an underlying increase in count of sites and countries and this would be a factor in rising clinical trial costs. But the data do not reveal this in any uniform way. For example, for Phase III breast cancer trials, both sites and number of countries show an upward trend. Yet when looking at patient segmentation, the trend lines for numbers of sites are positive for both subsets, while the country counts demonstrate a negative trend. For Phase III NSCLC trials, across all patient segments, as well as for the two segments assessed, the trend in numbers of sites is relatively flat. However, the time plots for the numbers of countries data show a positive trend for all trials, first-line trials and second-line trials. It may well be the case that with an additional one or two years of data collection (as trial results are fully reported), that more significant trends in geographic breadth will become more apparent.
Unfortunately, surprising trends reported here can’t speak directly to the widely cited increasing costs of clinical development. The extensive benchmark timing data available at Citeline has just begun to be mined. Trends in trials involving genetically segmented patients, biomarker stratified patients, or those using personalized medicine are all topics that bear study. There has been a significant growth in development and launch of biologics; could trials for biologics be “quicker” than those involving small molecules? As the database grows, the universe of potential analysis will expand.
Definitions and methodology
- Targeted therapies are defined as drugs falling into the following therapeutic classes in Trialtrove: anticancer, immunological; anticancer, vaccine; immunotoxin; antibody-drug conjugate; immunoconjugate, other; gene therapy; cellular therapy, other. Trials included were limited to when a targeted therapy was a primary drug, as opposed to background or standard regiment use in trials
- Study period is defined as the period that a trial patient is on regimen. Where wash-out periods are mandated, the study period includes this. For event-driven outcome trials, Citeline analysts determine the average study period based on published data and results. The study periods are for the entire trial; site-level data is not reliably available in the public domain.
- Enrollment period is broadly defined as that period reported in the public domain that clearly states enrollment start and end dates, or enrollment durations in months or years, for the trial. Alternatively, an enrollment period may be derived from press releases that report on a trial’s start of enrollment or first patient enrolled, screened or if no other data is available, randomized, and a report of last patient enrolled (or randomized) or trial closure. Enrollment periods are at the trial level; site-level data is not reliably available in the public domain. Nor is site start up time available in the public domain and Citeline benchmark timing data does not reflect time for this.
- Trial duration is defined as the sum of enrollment and study periods.